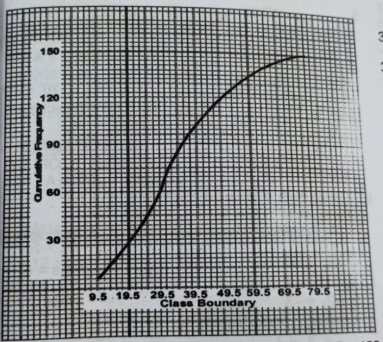
Using the cumulative frequency curve, estimate the median of the data represented on the graph.
Attached Figure / Diagram
A
35.5
B
36.5
C
37.5
D
38.5
Verified Correct Answer: B.
Step-by-Step Mathematical Solution
Median = \(\frac{\text{N}}{2}\) th item
= \(\frac{150}{2}\) th ≈ 36.5 from the graph.
Source: Myschool Past Questions Archive (Record #54930)