Question Library
Browse, filter, and study verified past examination questions with step-by-step mathematical reasoning.
Searching 18,000+ Questions...
Sifting topics, KaTeX formulas & verified solutions
Showing 91–105 of 345 verified questions
Sort by:
Mathematics
WAEC / WASSCE 2013
Statistics and Probability
Solution
Which of the following is not a probability of Mary scoring 85% in a mathematics test?
A
0.15
B
0.57
C
0.94
D
1.01
medium Difficulty
Verified Correct Answer: Option D
Step-by-Step Mathematical Solution
The probability not scoring 85% is = 1 - pro(scoring 85%)
= 1 - \(\frac{85}{100}\) = 1 - 0.85
= 0.15
not scoring would be less than 1. Hence option D is correct because the probability of an event cannot be more than 1.
Source: Myschool Past Questions Archive (Record #36881)
Mathematics
UTME / JAMB 2012
Statistics and Probability
Solution
The mean of seven numbers is 96. If an eighth number is added, the mean becomes 112. Find the eighth number.
A
126
B
180
C
216
D
224
medium Difficulty
Verified Correct Answer: Option D
Step-by-Step Mathematical Solution
\(\frac{x}{7} = \frac{96}{1}\) ==> \(\frac{672 + x}{8} = 112\)
Therefore x = 224
Source: Myschool Past Questions Archive (Record #27344)
Mathematics
UTME / JAMB 2012
Statistics and Probability
Solution
Find the median of 2,3,7,3,4,5,8,9,9,4,5,3,4,2,4 and 5
A
9
B
8
C
7
D
4
medium Difficulty
Verified Correct Answer: Option D
Step-by-Step Mathematical Solution
Arrange all the values in ascending order,
2,2,3,3,3,4,4,4,4,5,5,5,7,8,9,9
Source: Myschool Past Questions Archive (Record #27379)
Mathematics
UTME / JAMB 2012
Statistics and Probability
Solution
The probability that a student passes a physics test is \(\frac{2}{3}\). If he takes three physics tests, what is the probability that he passes two of the tests?
A
\(\frac{2}{27}\)
B
\(\frac{3}{27}\)
C
\(\frac{4}{27}\)
D
\(\frac{5}{3}\)
medium Difficulty
Verified Correct Answer: Option C
Step-by-Step Mathematical Solution
Pass(P) = \(\frac{2}{3}\), Fail(F) = \(\frac{1}{3}\)
T = P.P.F ==> \(\frac{2}{3} \times \frac{2}{3} \times \frac{1}{3}\) = \(\frac{4}{27}\)
Source: Myschool Past Questions Archive (Record #27397)
Mathematics
UTME / JAMB 2012
Statistics and Probability
Solution
The probabilities that a man and his wife live for 80 years are \(\frac{2}{3}\) and \(\frac{3}{5}\) respectively. Find the probability that at least one of them will live up to 80 years
A
\(\frac{2}{15}\)
B
\(\frac{3}{15}\)
C
\(\frac{7}{15}\)
D
\(\frac{13}{15}\)
medium Difficulty
Verified Correct Answer: Option D
Step-by-Step Mathematical Solution
Man lives = \(\frac{2}{3}\) not live = \(\frac{1}{3}\)
Wife lives = \(\frac{3}{5}\) not live = \(\frac{2}{5}\)
P(at least one lives to 80 years) = P(man lives to 80 not woman) + P(woman lives to 80 and not man) + P(both live to 80)
\(P = (\frac{2}{3} \times \frac{2}{5}) + (\frac{2}{5} \times \frac{1}{3}) + (\frac{2}{3} \times \frac{3}{5})\)
= \(\frac{4}{15} + \frac{3}{15} + \frac{6}{15}\)
= \(\frac{13}{15}\)
Source: Myschool Past Questions Archive (Record #27399)
Mathematics
WAEC / WASSCE 2012
Statistics and Probability
Solution
A bag contains 4 red and 6 black balls of the same size. If the balls are shuffled briskly and two balls are drawn one after the other without replacement, find the probability of picking balls of different colours
A
\(\frac{8}{15}\)
B
\(\frac{13}{25}\)
C
\(\frac{11}{15}\)
D
\(\frac{13}{15}\)
medium Difficulty
Verified Correct Answer: Option A
Step-by-Step Mathematical Solution
Prob(RB + BR) = Total balls = 4 + 6 = 10
= prob(\(\frac{4}{10} \times \frac{6}{9}\)) + prob(\(\frac{6}{10} \times \frac{4}{9}) = \frac{24}{90} + \frac{24}{90}\)
= \(\frac{48}{90} = \frac{16}{30} = \frac{8}{15}\)
Source: Myschool Past Questions Archive (Record #36780)
Mathematics
WAEC / WASSCE 2012
Statistics and Probability
Diagram
Solution
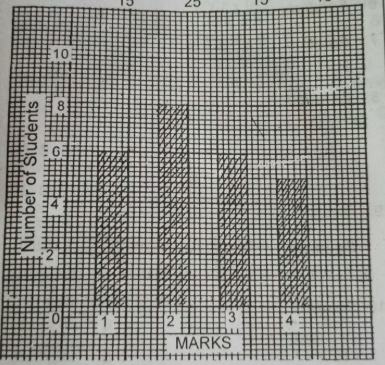
The bar chart shows the frequency distribution of marks scored by students in a class test. How many students are in the class?
Attached Figure / Diagram
A
10
B
24
C
25
D
30
medium Difficulty
Verified Correct Answer: Option C
Step-by-Step Mathematical Solution
6 + 8 + 6 + 5 = 25
Source: Myschool Past Questions Archive (Record #36813)
Mathematics
WAEC / WASSCE 2012
Statistics and Probability
Diagram
Solution
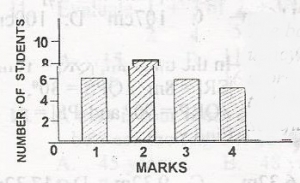
The bar chart shows the frequency distribution of marks scored by students in a class test. Calculate the mean of the distribution.
Attached Figure / Diagram
A
6.0
B
3.0
C
2.4
D
1.8
medium Difficulty
Verified Correct Answer: Option C
Step-by-Step Mathematical Solution
\(\begin{array}{c|c} x & f & fx\\ \hline 1 & 6 & 6 \\
2 & 8 & 16\\ 3 & 8 & 18\\ 4 & 5 & 20\end{array}\)
mean x = \(\frac{\sum fx}{\sum f}\)
= \(\frac{60}{25}\)
x = 2.4
Source: Myschool Past Questions Archive (Record #36814)
Mathematics
WAEC / WASSCE 2012
Statistics and Probability
Diagram
Solution
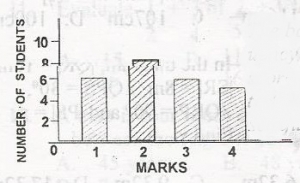
The bar chart shows the frequency distribution of marks scored by students in a class test. What is the median of the distribution?
Attached Figure / Diagram
A
2
B
4
C
6
D
8
medium Difficulty
Verified Correct Answer: Option A
Step-by-Step Mathematical Solution
median = (\(\frac{N + 1}{2}\))th = (\(\frac{25 + 1}{2}\))th
= \(\frac{26th}{2}\)
= 13th
the 13th is 2
Source: Myschool Past Questions Archive (Record #36815)
Mathematics
WAEC / WASSCE 2012
Statistics and Probability
Solution
(a) A box contains 40 identical discs which are either red or white. If the probability of picking a red disc is \(\frac{1}{4}\); Calculate the number of (i) white discs ; (ii) red discs that should be added such that the probability of picking a red disc will be \(\frac{1}{3}\).
(b) A salesman bought some plates at N50.00 each. If he sold all of them for N600.00 and made a profit of 20% on the transaction, how many plates did he buy?
medium Difficulty
Verified Correct Answer: Option
Step-by-Step Mathematical Solution
(a) (i) No of red discs = \(\frac{1}{4} \times 40 = 10\)
Total no of discs = 40
\(\therefore\) No of white balls = 40 - 10 = 30
(ii) Let the number of red balls to be added = z
\(\therefore \frac{10 + z}{40 + z} = \frac{1}{3}\)
\(3(10 + z) = 40 + z\)
\(30 + 3z = 40 + z \implies 3z - z = 40 - 30\)
\(2z = 10 \implies z = 5\)
Therefore, adding 5 red discs, the probability of picking a red disc = \(\frac{1}{3}\).
(b) CP of a plate = N50.00
Let the number of plates be x
\(\therefore \text{CP of x plates} = N50x\)
\(\text{SP of all plates} = N600\)
\(\frac{100 + 20}{100} \times N50x = N600 \implies N60x = N600\)
\(x = \frac{600}{60} = 10 plates\)
Source: Myschool Past Questions Archive (Record #52688)
Mathematics
UTME / JAMB 2011
Statistics and Probability
Solution
Class Intervals
0-2
3-5
6-8
9-11
Frequency
3
2
5
3
Find the mode of the above distribution.
A
9
B
8
C
10
D
7
medium Difficulty
Verified Correct Answer: Option D
Step-by-Step Mathematical Solution
Mode = L1 + (\(\frac{D_1}{D_1 + D_2}\))C
D1 = frequency of modal class - frequency of the class before it
D1 = 5 - 2 = 3
D2 = frequency of modal class - frequency of the class that offers it
D2 = 5 - 3 = 2
L1 = lower class boundary of the modal class
L1 = 5 - 5
C is the class width = 8 - 5.5 = 3
Mode = L1 + (\(\frac{D_1}{D_1 + D_2}\))C
= 5.5 + \(\frac{3}{2 + 3}\)C
= 5.5 + \(\frac{3}{5}\) x 3
= 5.5 + \(\frac{9}{5}\)
= 5.5 + 1.8
= 7.3 \(\approx\) = 7
Source: Myschool Past Questions Archive (Record #29493)
Mathematics
UTME / JAMB 2011
Statistics and Probability
Solution
\(\begin{array}{c|c} No & 0 & 1 & 2 & 3 & 4 & 5 \\ \hline Frequency & 1 & 4 & 3 & 8 & 2 & 5 \end{array}\). From the table above, find the median and range of the data respectively.
A
(8,5)
B
(3, 5)
C
(5 , 8)
D
(5 , 3)
medium Difficulty
Verified Correct Answer: Option B
Step-by-Step Mathematical Solution
Median = \(\sum f\) = 23+1 = 24Th = \(\frac{24}{2}\) = 12TH position is 8 = 3
Range = 5 - 0 = 5
(3, 5)
Source: Myschool Past Questions Archive (Record #29513)
Mathematics
WAEC / WASSCE 2011
Statistics and Probability
Solution
If a number is chosen at random from the set {x: 4 \(\leq x \leq 15\)}. Find the probability that it is a multiple of 3 or a multiple of 4
A
\(\frac{1}{2}\)
B
\(\frac{5}{12}\)
C
\(\frac{7}{12}\)
D
\(\frac{11}{12}\)
medium Difficulty
Verified Correct Answer: Option A
Step-by-Step Mathematical Solution
set = 4, 5, 6, 7, 8, 9, 10, 11, 12, 13, 14, 15
multiples of 3 = 6, 9, 12, 15
multiples of 4 = 4, 8, 12
Prob(multiples of 3 or 4) = Prob(multiple of 3) + pro(multiple of 4) - pro(3 ∩ 4)
= \(\frac{4}{12} + \frac{3}{12} = \frac{7}{12} - \frac{1}{2}\) = \(\frac{4 + 3 - 1}{12}\)
= \(\frac{1}{2}\)
Source: Myschool Past Questions Archive (Record #36633)
Mathematics
WAEC / WASSCE 2011
Statistics and Probability
Diagram
Solution
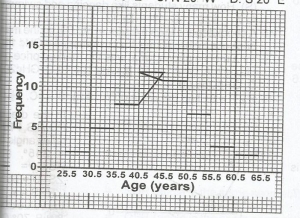
The histogram shows the age distribution of members of a club. What is their modal age?
Attached Figure / Diagram
A
44.5
B
42.5
C
41.5
D
40.5
medium Difficulty
Verified Correct Answer: Option D
Step-by-Step Mathematical Solution
Modal class ≈ 40.5
That is, the class having the highest frequency.
Source: Myschool Past Questions Archive (Record #36704)
Mathematics
UTME / JAMB 2010
Statistics and Probability
Solution
Marks
1
2
3
4
5
Frequency
2
2
8
4
4
The table above show the marks obtained in a given test.
How many student took the test?
A
16
B
13
C
20
D
15
medium Difficulty
Verified Correct Answer: Option C
Step-by-Step Mathematical Solution
∑f = 2 + 2 + 8 + 4 + 4
= 20
Source: Myschool Past Questions Archive (Record #10323)