Question Library
Browse, filter, and study verified past examination questions with step-by-step mathematical reasoning.
Searching 18,000+ Questions...
Sifting topics, KaTeX formulas & verified solutions
Showing 301–315 of 345 verified questions
Sort by:
Mathematics
UTME / JAMB 1990
Statistics and Probability
Solution
Find the probability that a number selected at random from 41 to 56 is a multiply of 9
A
\(\frac{1}{8}\)
B
\(\frac{2}{15}\)
C
\(\frac{3}{16}\)
D
\(\frac{7}{8}\)
medium Difficulty
Verified Correct Answer: Option A
Step-by-Step Mathematical Solution
Given from 41 to 56
41, 42, 43, 44, 45, 46, 47, 48, 49, 50, 51, 52, 53, 54, 55, 56
The nos multiple of 9 are: 45, 54
P(multiple of 9) = \(\frac{2}{16}\)
= \(\frac{1}{8}\)
Source: WAEC / JAMB / NECO Classroom Archive (Record #31490)
Mathematics
WAEC / WASSCE 1990
Statistics and Probability
Diagram
Solution
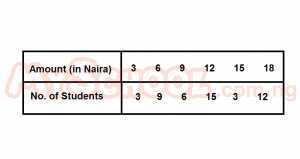
The table shows that the amount of money (in naira)collected through voluntary donations in a secondary school. What is the mode?
Attached Figure / Diagram
A
N3
B
N6
C
N9
D
N12
E
N15
medium Difficulty
Verified Correct Answer: Option D
Step-by-Step Mathematical Solution
Mode = 12
Source: Myschool Past Questions Archive (Record #22699)
Mathematics
WAEC / WASSCE 1990
Statistics and Probability
Diagram
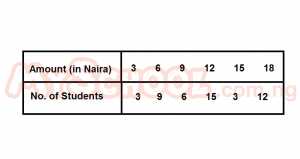
The table shows that the amount of money (in naira)collected through voluntary donations in a secondary school.
What is the median of distribution
Attached Figure / Diagram
A
N3.00
B
N9.00
C
N12.00
D
N15.00
E
N18.00
medium Difficulty
Verified Correct Answer: Option C
Step-by-Step Mathematical Solution
No expanded working has been attached for this question yet. The verified answer is Option C.
Source: Myschool Past Questions Archive (Record #22700)
Mathematics
WAEC / WASSCE 1990
Statistics and Probability
Solution
Two groups of male students cast their votes on a particular proposal. The result are as follows:
In favor
Against
Group A
128
32
Group B
96
48
If a student in favor of the proposal is selected for a post, what is the probability that he is from group A?
A
8/19
B
16/35
C
10/19
D
4/7
E
4/5
medium Difficulty
Verified Correct Answer: Option A
Step-by-Step Mathematical Solution
Probability that a student in favor is group A
= \(\frac{128}{128 + 32 + 96 + 48}\)
= \(\frac{128}{304}\)
= \(\frac{8}{19}\)
Source: Myschool Past Questions Archive (Record #22701)
Mathematics
WAEC / WASSCE 1990
Statistics and Probability
Solution
Two groups of male students cast their vote on a particular proposal. The results are as follows:
In favor
Against
Group A
128
32
Group B
96
48
If a student is chosen at random, what is probability that he is against the proposal?
A
3/19
B
4/19
C
5/19
D
9/19
E
10/19
medium Difficulty
Verified Correct Answer: Option C
Step-by-Step Mathematical Solution
Probability that the student is against the proposal
= \(\frac{32 + 48}{128 + 32 + 96 + 48}\)
= \(\frac{80}{304}\)
= \(\frac{5}{19}\)
Source: Myschool Past Questions Archive (Record #22702)
Mathematics
WAEC / WASSCE 1990
Statistics and Probability
Solution
(a) If a number is chosen at random from the integers 5 to 25 inclusive, find the probability that the number is a multiple of 5 or 3.
(b) A bag contains 10 balls that differ only in colour; 4 are blue and 6 are red. Two balls are picked one after the other, with replacement. What is the probability that:
(i) both are red? (ii) both are the same colour?
medium Difficulty
Verified Correct Answer: Option
Step-by-Step Mathematical Solution
(a) Let S = sample space = integers from 5 to 25 inclusive.
F = multiple of 5 ; T = multiple of 3.
S = {5, 6, 7, 8, 9, 10, 11, 12, 13, 14, 15, 16, 17, 18, 19, 20, 21, 22, 23, 24, 25}
F = {5, 10, 15, 20, 25}; T = {6, 9, 12, 15, 18, 21, 24}
P(F or T) = \(\frac{5}{21} + \frac{7}{21} = \frac{12}{21} = \frac{4}{7}\)
(b) Let B = blue balls and R = red balls
n(B) = 4 ; n(R) = 6.
(i) P(both are red) = \(\frac{6}{10} \times \frac{6}{10} = \frac{36}{100}\)
= \(\frac{9}{25}\)
(ii) P(both are same colour) = P(both are red) or P(both are blue)
= \(\frac{9}{25} + (\frac{2}{5} \times \frac{2}{5})\)
= \(\frac{9}{25} + \frac{4}{25}\)
= \(\frac{13}{25}\)
Source: Myschool Past Questions Archive (Record #54648)
Mathematics
WAEC / WASSCE 1989
Statistics and Probability
What is the mode of the score
A
3
B
4
C
5
D
6
E
7
medium Difficulty
Verified Correct Answer: Option E
Step-by-Step Mathematical Solution
No expanded working has been attached for this question yet. The verified answer is Option E.
Source: Myschool Past Questions Archive (Record #22399)
Mathematics
WAEC / WASSCE 1989
Statistics and Probability
Diagram
Solution
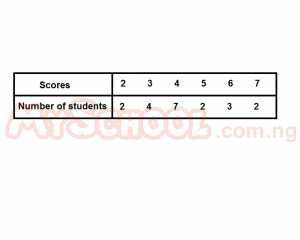
The table above gives the scores of a group of students in an English Language test
If a student is chosen at random from the group, what is the probability that the scored at least 6 marks?
Attached Figure / Diagram
A
3/20
B
1/5
C
1/4
D
3/10
E
3/4
medium Difficulty
Verified Correct Answer: Option C
Step-by-Step Mathematical Solution
Probability = 5/20 = 1/4
Source: Myschool Past Questions Archive (Record #22407)
Mathematics
UTME / JAMB 1989
Statistics and Probability
Solution
If n is the median and m is the mode of the following set of numbers, 2.4, 2.1, 1.6, 2.6, 2.6, 3.7, 2.1, 2.6, then (n, m) is
A
(2.6, 2.6)
B
(2.5, 2.6)
C
(2.6, 2.5)
D
(2.5, 2.1)
medium Difficulty
Verified Correct Answer: Option B
Step-by-Step Mathematical Solution
Arrange the numbers in order, 1.6, 2.1, 2.1| 2.4, 2.6| 2.6, 2.6, 3.7
n = median = \(\frac{2.4 + 2.6}{2}\)
= 2.5
m = mode = 2.6
∴ (n, m) = (2.5, 2.6)
Source: Myschool Past Questions Archive (Record #31626)
Mathematics
WAEC / WASSCE 1989
Statistics and Probability
Solution
The table shows the weights, to the nearest kilogram, of twelve students in a Further Mathematics class
Weight in kg
55
57
59
61
63
No of students
2
1
2
4
3
(a) Draw a bar chart to illustrate the above information;
(b) What is (i) the mode; (ii) the median of the distribution?
(c) Calculate the mean weight correct to the nearest kilogram.
medium Difficulty
Verified Correct Answer: Option
Step-by-Step Mathematical Solution
(a)
(b)(i) The mode is 61kg.
(ii) From the total number of students = 12, then the median is the average of the 6th and 7th weight.
From the table, the median = 61kg.
(c) Mean weight = \(\frac{\sum fx}{\sum f} = \frac{55 \times 2 + 57 \times 1 + 59 \times 2 + 61 \times 4 + 63 \times 3}{12}\)
= \(\frac{110 + 57 + 118 + 244 + 189}{12} = \frac{718}{12} = 59.833kg\)
\(\approxeq 60kg\)
Source: Myschool Past Questions Archive (Record #54659)
Mathematics
WAEC / WASSCE 1989
Statistics and Probability
Solution
(a) A pair of fair dice each numbered 1 to 6 is tossed. Find the probability of getting a sum of at least 9.
(b) If the probability that a civil servant owns a car is \(\frac{1}{6}\), find the probability that:
(i) two civil servants, A and B, selected at random each owns a car ; (ii) of two civil servants, C and D selected at random, only one owns a car ; (iii) of three civil servants, X, Y and Z, selected at random, only one owns a car.
medium Difficulty
Verified Correct Answer: Option
Step-by-Step Mathematical Solution
(a) Sample space for a pair of fair dice = 36 results
+
1
2
3
4
5
6
1
2
3
4
5
6
7
2
3
4
5
6
7
8
3
4
5
6
7
8
9
4
5
6
7
8
9
10
5
6
7
8
9
10
11
6
7
8
9
10
11
12
Total with sum at least 9 = 10
P(sum at least 9) = \(\frac{10}{36} = \frac{5}{18}\)
(b) P(civil servant owns a car) = \(\frac{1}{6}\)
P(civil servant owns no car) = \(\frac{5}{6}\)
(i) P(A and B own a car) = \(\frac{1}{6} \times \frac{1}{6} = \frac{1}{36}\)
(ii) P(C and D, only one owns a car) = P(C owns, not D) + P(not C but D owns)
= \((\frac{1}{6} \times \frac{5}{6}) + (\frac{5}{6} \times \frac{1}{6})\)
= \(\frac{5}{36} + \frac{5}{36}\)
= \(\frac{10}{36} = \frac{5}{18}\)
(iii) P(of X, Y and Z, only one owns a car) = P(X owns a car, not Y, not Z) + P(not X, Y owns a car, not Z) + P(not X, not Y, Z owns a car)
= \(3(\frac{1}{6} \times \frac{5}{6} \times \frac{5}{6})\)
= \(3 \times \frac{25}{216}\)
= \(\frac{25}{72}\)
Source: Myschool Past Questions Archive (Record #54690)
Mathematics
WAEC / WASSCE 1988
Statistics and Probability
Diagram
Solution
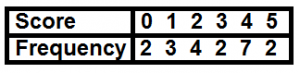
A group of students took a test and the following frequency table shows the scores above
Find the mode
Attached Figure / Diagram
A
2
B
3
C
4
D
5
E
7
medium Difficulty
Verified Correct Answer: Option C
Step-by-Step Mathematical Solution
The mode=4. It has the highest frequency of 7
Source: Myschool Past Questions Archive (Record #22018)
Mathematics
WAEC / WASSCE 1988
Statistics and Probability
Diagram
Solution
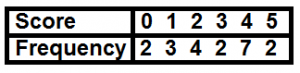
A group of students took a test and the following frequency table shows the scores above
The mean score is
Attached Figure / Diagram
A
1.75
B
2
C
2.5
D
2.75
E
3
medium Difficulty
Verified Correct Answer: Option D
Step-by-Step Mathematical Solution
Score
0
1
2
3
4
5
Total
Freq
2
3
4
2
7
2
20
\(fx\)
0
3
8
6
28
10
55
\(\bar{x} = \frac{\sum fx}{\sum f}\)
= \(\frac{55}{20}\)
= \(2.75\)
Source: Myschool Past Questions Archive (Record #22020)
Mathematics
WAEC / WASSCE 1988
Statistics and Probability
Diagram
Solution
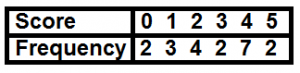
A group of students took a test and the following frequency table shows the scores above
The median score is
Attached Figure / Diagram
A
o
B
2.5
C
3
D
5
E
7
medium Difficulty
Verified Correct Answer: Option C
Step-by-Step Mathematical Solution
There are 20 students. Hence, the median is found by the average of the 10th and 11th score.
= \(\frac{3 + 3}{2}\)
= 3
Source: Myschool Past Questions Archive (Record #22021)
Mathematics
WAEC / WASSCE 1988
Statistics and Probability
Solution
The surnames of 40 children in a class arranged in alphabetical order. 16 of the surnames begins with O and 9 of the surname begins with A, 14, of the letters of the alphabet do not appear as the first letter of a surname
What is the probability that the surname of a child picked at random from the class begins with either O or A?
A
5/8
B
7/8
C
9/16
D
14/25
E
39/40
medium Difficulty
Verified Correct Answer: Option A
Step-by-Step Mathematical Solution
No. of possible outcome = 40
No. of expected outcome = 16 + 9 = 25
Probability = 25/40 = 5/8
Source: Myschool Past Questions Archive (Record #22230)