Question Library
Browse, filter, and study verified past examination questions with step-by-step mathematical reasoning.
Searching 18,000+ Questions...
Sifting topics, KaTeX formulas & verified solutions
Showing 271–285 of 345 verified questions
Sort by:
Mathematics
UTME / JAMB 1993
Statistics and Probability
Solution
\(\begin{array}{c|c} Weight(s) & 0 -10 & 10 - 20 & 20 - 30 &30 - 40 & 40 - 50\\ \hline \text{Number of coconuts} & 10 & 27 & 19 & 6 & 2\end{array}\)
Weight(g)
0-10
10-20
20-30
30-40
40-50
No. of coconuts
10
27
19
6
2
Estimate the mode of the frequency distribution above
A
13.2g
B
15.0g
C
16.8g
D
17.5g
medium Difficulty
Verified Correct Answer: Option C
Step-by-Step Mathematical Solution
Mode = a + \(\frac{(b - a)(F_m - F_b)}{2F_m - F_a - F_b}\)
= \(L_1 + \frac{\Delta_1 x^\text{c}}{\Delta_1 + \Delta_2}\)
= \(10 + \frac{(20 - 10)(27 - 10)}{2(27) - 10 - 19}\)
= 10 + \(\frac{170}{25}\)
= 10 + 6.8
= 16.8
Source: Myschool Past Questions Archive (Record #31271)
Mathematics
UTME / JAMB 1993
Statistics and Probability
Solution
The mean of the ages of ten secondary school pupils is 16 but when the age of their teacher is added to it the men becomes 19. Find the age of the teacher
A
27
B
35
C
38
D
49
medium Difficulty
Verified Correct Answer: Option D
Step-by-Step Mathematical Solution
Average age of 110 students = 16
∴ Total age = 16 x 10 = 160 years
Age of teachers = x, total number of people now = 11
mean age = 19
Total age of new group = 19 x 11 = 209
Age of teachers = x = (209 - 160) = 49 yrs
Source: Myschool Past Questions Archive (Record #31274)
Mathematics
UTME / JAMB 1993
Statistics and Probability
Solution
\(\begin{array}{c|c} Class & Frequency\\ \hline 1 - 5 & 2\\6 - 10 & 4\\11 - 15 & 5\\16 - 20 & 2 \\ 21 - 25 & 3\\26 - 30 & 2\\31 - 35 & 1\\36 - 40 & 1 \end{array}\)
Find the median of the observation in the table given
A
11.5
B
12.5
C
14.0
D
14.5
medium Difficulty
Verified Correct Answer: Option D
Step-by-Step Mathematical Solution
Median = L1 + (\(\frac{Ef}{fm}\)) - fo
\(\frac{\sum f}{2}\)
= \(\frac{20}{2}\)
= 10, L1 = 10.5, fo = 6, fm = 5
Median = 10.5 + \(\frac{(10 - 6)}{5}\)5
= 10.5 + 4
= 14.5
Source: Myschool Past Questions Archive (Record #31280)
Mathematics
WAEC / WASSCE 1993
Statistics and Probability
Solution
A box contains identical balls of which 12 are red, 16 white and 8 blue. Three balls are drawn from the box one after the other without replacement. Find the probability that :
(a) three are red;
(b) the first is blue and the other two are red;
(c) two are white and one is blue.
medium Difficulty
Verified Correct Answer: Option
Step-by-Step Mathematical Solution
n(R) = number of red balls = 12;
n(W) = number of white balls = 16;
n(B) = number of blue balls = 8
Total number of balls = 36
(a) P(three are red) = \(\frac{12}{36} \times \frac{11}{35} \times \frac{10}{34}\)
= \(\frac{11}{357}\)
(b) P(first is blue and other two red) = \(\frac{8}{36} \times \frac{12}{35} \times \frac{11}{34}\)
= \(\frac{44}{1785}\)
(c) P(two are white and one is blue) = \(\frac{16}{36} \times \frac{15}{35} \times \frac{8}{34}\)
= \(\frac{16}{357}\)
Source: Myschool Past Questions Archive (Record #54569)
Mathematics
WAEC / WASSCE 1993
Statistics and Probability
Solution
The table below shows the frequency distribution of the marks scored by fifty students in an examination.
Marks (%)
0-9
10-19
20-29
30-39
40-49
50-59
60-69
70-79
80-89
90-99
Freq
2
3
4
6
13
10
5
3
2
2
(a) Draw the cumulative frequency curve for the distribution.
(b) Use your curve to estimate the : (i) upper quartile; (ii) pass mark if 60% of the students passed.
medium Difficulty
Verified Correct Answer: Option
Step-by-Step Mathematical Solution
Marks
Upper class
boundary
Freq
Cum Freq
0-9
9.5
2
2
10-19
19.5
3
5
20-29
29.5
4
9
30-39
39.5
6
15
40-49
49.5
13
28
50-59
59.5
10
38
60-69
69.5
5
43
70-79
79.5
3
46
80-89
89.5
2
48
90-99
99.5
2
50
(a)
(b)(i) Upper quartile \(Q_{3}\) = 57 marks
(ii) Pass mark if 60% of the class passed = 42 marks
Source: Myschool Past Questions Archive (Record #54576)
Mathematics
WAEC / WASSCE 1992
Statistics and Probability
Find the median of the following set of scores:
65, 72, 55, 48, 78
A
55
B
60
C
63.5
D
65
E
72
medium Difficulty
Verified Correct Answer: Option D
Step-by-Step Mathematical Solution
No expanded working has been attached for this question yet. The verified answer is Option D.
Source: Myschool Past Questions Archive (Record #23175)
Mathematics
WAEC / WASSCE 1992
Statistics and Probability
Diagram
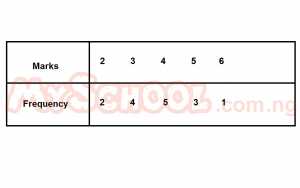
The data above shows the frequency distribution
of marks scored by a group of students in a class
test.
How many students took the test?
Attached Figure / Diagram
A
13
B
14
C
15
D
18
E
20
medium Difficulty
Verified Correct Answer: Option C
Step-by-Step Mathematical Solution
No expanded working has been attached for this question yet. The verified answer is Option C.
Source: Myschool Past Questions Archive (Record #23176)
Mathematics
WAEC / WASSCE 1992
Statistics and Probability
Diagram
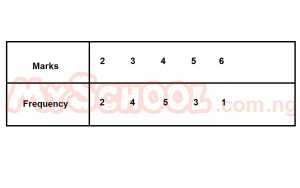
The data below shows the frequency distribution
of marks scored by a group of students in a class
test.
What is the modal score
Attached Figure / Diagram
A
2
B
3
C
4
D
5
E
6
medium Difficulty
Verified Correct Answer: Option C
Step-by-Step Mathematical Solution
No expanded working has been attached for this question yet. The verified answer is Option C.
Source: Myschool Past Questions Archive (Record #23177)
Mathematics
WAEC / WASSCE 1992
Statistics and Probability
Diagram
Solution
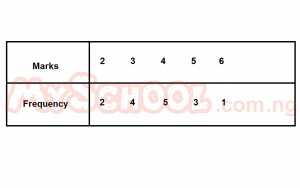
The data below shows the frequency distribution
of marks scored by a group of students in a class
test.
Find the mean mark.
Attached Figure / Diagram
A
1
B
1.3
C
2
D
3
E
3.8
medium Difficulty
Verified Correct Answer: Option E
Step-by-Step Mathematical Solution
Mean(x) = \(\frac{ ∑fx}{ ∑f}\)
Mean(x) = \(\frac{ 2 \times 2 + 3 \times 4 + 5 \times 4 + 3 \times 5 + 6 \times 1}{ 2 + 3 + 5 + 3 + 1}\)
= \(\frac{57}{15}\) = 3.8
Source: Myschool Past Questions Archive (Record #23178)
Mathematics
WAEC / WASSCE 1992
Statistics and Probability
Solution
A number is chosen at random from the set (1 ,2,3
....,9, 10). What is the probability that the number
is greater than or equal to 7?
A
1/10
B
3/10
C
2/5
D
3/5
E
7/10
medium Difficulty
Verified Correct Answer: Option C
Step-by-Step Mathematical Solution
The given set {1, 2, 3, 4 ...., 9, 10}
(x ≥ 7 ) = 7 7, 8, 9, 10 = 4
Total number of possible outcome = 10
4/10 = 2/5
Source: Myschool Past Questions Archive (Record #23181)
Mathematics
WAEC / WASSCE 1992
Statistics and Probability
A fair die is rolled once. What is the probability of
obtaining 4 or 6?
A
1/12
B
1/6
C
1/3
D
1/2
E
2/3
medium Difficulty
Verified Correct Answer: Option C
Step-by-Step Mathematical Solution
No expanded working has been attached for this question yet. The verified answer is Option C.
Source: Myschool Past Questions Archive (Record #23183)
Mathematics
WAEC / WASSCE 1992
Statistics and Probability
Solution
Three balls are drawn one after the other with replacement, from a bag containing 5 red, 9white and 4 blue identical balls, What is the probability that they are one red, one white and one blue?
A
5/102
B
5/136
C
5/162
D
5/204
E
5/243
medium Difficulty
Verified Correct Answer: Option C
Step-by-Step Mathematical Solution
Total number of balls = 18
P(1R, 1W, 1B) = 5/18 x 9/18 x 4/18 = 5/162
Source: Myschool Past Questions Archive (Record #23184)
Mathematics
WAEC / WASSCE 1992
Statistics and Probability
The data below shows the number of worker?
employed in the various sections of a construction
company in Lagos.
Carpenters 24 Labourers 27
Plumbers 12 Plasterers 15
Painters 9 Messengers 3
Bricklayers 18
If one of the workers is absent on a certain day,
what is the probability that he is a bricklayer?
A
1/12
B
1/9
C
2/9
D
1/6
E
1/4
medium Difficulty
Verified Correct Answer: Option D
Step-by-Step Mathematical Solution
No expanded working has been attached for this question yet. The verified answer is Option D.
Source: Myschool Past Questions Archive (Record #23185)
Mathematics
WAEC / WASSCE 1992
Statistics and Probability
The data below shows the number of worker?
employed in the various sections of a construction
company in Lagos.
Carpenters 24 Labourers 27
Plumbers 12 Plasterers 15
Painters 9 Messengers 3
Bricklayers 18
If a worker is retrenched, what is the probability that he is a plumber or plasterer.
A
1/27
B
1/9
C
5/36
D
1/4
E
3/4
medium Difficulty
Verified Correct Answer: Option D
Step-by-Step Mathematical Solution
No expanded working has been attached for this question yet. The verified answer is Option D.
Source: Myschool Past Questions Archive (Record #23186)
Mathematics
UTME / JAMB 1992
Statistics and Probability
Solution
\(\begin{array}{c|c} x & 2 & 4 & 6 & 8\\ \hline f & 4 & y & 6 & 5 \end{array}\)
If the mean of the above frequency distribution is 5.2, find y
A
6.0
B
5.2
C
5.0
D
4.0
medium Difficulty
Verified Correct Answer: Option C
Step-by-Step Mathematical Solution
Mean \(\bar{x}\) = \(\frac{\sum fx}{\sum f}\)
= \(\frac{5.2}{1}\)
= \(\frac{8 + 4y + 36 + 40}{4 + y + 6 + 5}\)
= \(\frac{5.2}{1}\) = \(\frac{84 + 4y}{15 + y}\)
= 5.2(15 + y) = 84 + 4y
= 84 + 4y = 78 + 5.2y
= 5.2y - 4y = 84 - 78
1.2y = 6
y = \(\frac{6}{1.2}\)
= \(\frac{60}{12}\)
= 5
Source: Myschool Past Questions Archive (Record #31358)