Question Library
Browse, filter, and study verified past examination questions with step-by-step mathematical reasoning.
Searching 18,000+ Questions...
Sifting topics, KaTeX formulas & verified solutions
Showing 226–240 of 345 verified questions
Sort by:
Mathematics
WAEC / WASSCE 1998
Statistics and Probability
Solution
The table below shows the number of eggs laid by the chickens in a man's farm in a year.
No of eggs per year
No of chickens
45 - 49
10
50 - 54
36
55 - 59
64
60 - 64
52
65 - 69
28
70 - 74
10
(a) Draw a cumulative frequency curve for the distribution.
(b) Use your graph to find the interquartile range.
(c) If a woman buys a chicken from the farm, what is the probability that the chicken lays at least 60 eggs in a year?
medium Difficulty
Verified Correct Answer: Option
Step-by-Step Mathematical Solution
(a)
No of eggs
per year
Class boundaries
Freq
Cum Freq
45 - 49
44.5 - 49.5
10
10
50 - 54
49.5 - 54.5
36
46
55 - 59
54.5 - 59.5
64
110
60 - 64
59.5 - 64.5
52
162
65 - 69
64.5 - 69.5
28
190
70 - 74
69.5 - 74.5
10
200
(b) From the graph, the interquartile range = \(Q_{3} - Q_{1} = 63 - 54 = 9\)
(c) Probability of a chicken laying at least 60 eggs in a year = \(\frac{52 + 28 + 10}{200}\)
= \(\frac{90}{200} = \frac{9}{20}\)
Source: Myschool Past Questions Archive (Record #54454)
Mathematics
WAEC / WASSCE 1997
Statistics and Probability
Diagram
Solution
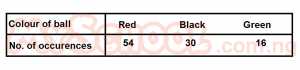
A bag contains red, black and green identical balls. A ball is picked and replaced. The table shows the result of 100 trials. Find the experimental probability of picking a green ball.
Attached Figure / Diagram
A
16
B
21/25
C
1/3
D
4/21
E
4/25
medium Difficulty
Verified Correct Answer: Option E
Step-by-Step Mathematical Solution
Prob(green ball) = 16/100
= 4/25
Source: Myschool Past Questions Archive (Record #23905)
Mathematics
WAEC / WASSCE 1997
Statistics and Probability
Solution
A bag contains 3 white, 6 red, 5 blue identical balls. A ball is picked at random from bag. What is the probability that is either white or blue?
A
9/14
B
4/7
C
3/7
D
5/14
E
3/14
medium Difficulty
Verified Correct Answer: Option B
Step-by-Step Mathematical Solution
P(W or B) = 3/14 + 5/14 = 4/7
Source: Myschool Past Questions Archive (Record #23908)
Mathematics
UTME / JAMB 1997
Statistics and Probability
Solution
Ages
20
25
30
35
40
45
Number of people
3
5
1
1
2
3
Find the median age of the frequency distribution in the table above.
A
20
B
25
C
30
D
35
medium Difficulty
Verified Correct Answer: Option B
Step-by-Step Mathematical Solution
Total freq = 15
Median position = \(\frac{n + 1}{2}\) for odd numbers
Median position = \(\frac{15 + 1}{2}\) = \(\frac{16}{2}\) = 8th position.
From the table, the 8th position corresponds to age 25.
Source: Myschool Past Questions Archive (Record #30859)
Mathematics
UTME / JAMB 1997
Statistics and Probability
Solution
Find the difference between the range and the variance of the following set of numbers 4, 9, 6, 3, 2, 8, 10, 5, 6, 7 where \(\sum d^2\) = 60
A
2
B
3
C
4
D
6
medium Difficulty
Verified Correct Answer: Option A
Step-by-Step Mathematical Solution
Range : 10 - 2 = 8
Variance = \(\frac{\sum d^{2}}{n}\)
= \(\frac{60}{10}\)
= 6
8 - 6 = 2.
Source: Myschool Past Questions Archive (Record #30863)
Mathematics
UTME / JAMB 1997
Statistics and Probability
Solution
In a basket of fruits, there are 6 grapes, 11 bananas and 13 oranges, if one fruit is chosen at random, what is the probability that the fruit is either a grape or a banana?
A
\(\frac{17}{30}\)
B
\(\frac{11}{30}\)
C
\(\frac{6}{30}\)
D
\(\frac{5}{30}\)
medium Difficulty
Verified Correct Answer: Option A
Step-by-Step Mathematical Solution
Pgrape or Pbanana = \(\frac{6}{30}\) + \(\frac{11}{30}\)
= \(\frac{17}{30}\)
Source: Myschool Past Questions Archive (Record #30867)
Mathematics
UTME / JAMB 1997
Statistics and Probability
Solution
A number is selected at random between 10 and 20, both numbers inclusive. Find the probability that the number is an even number
A
\(\frac{5}{11}\)
B
\(\frac{1}{2}\)
C
\(\frac{6}{11}\)
D
\(\frac{7}{10}\)
medium Difficulty
Verified Correct Answer: Option C
Step-by-Step Mathematical Solution
n(even numbers between 10 and 20 inclusive) = 6
n(numbers between 10 and 20) = 11
P(even) = \(\frac{6}{11}\)
Source: Myschool Past Questions Archive (Record #30868)
Mathematics
WAEC / WASSCE 1996
Statistics and Probability
Diagram
Solution
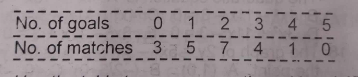
The number of goals scored by a football team in 20 matches is shown in the table above
What is the mean goal scored?
Attached Figure / Diagram
A
0.75
B
1.75
C
1.9
D
2
E
2.15
medium Difficulty
Verified Correct Answer: Option B
Step-by-Step Mathematical Solution
Mean =
∑fx/∑f
=
35/20
= 13/4 = 1.75
Source: Myschool Past Questions Archive (Record #23833)
Mathematics
WAEC / WASSCE 1996
Statistics and Probability
The cumulative frequency curve may be used to find the
A
variance
B
standard deviation
C
mode
D
median
E
mean
medium Difficulty
Verified Correct Answer: Option D
Step-by-Step Mathematical Solution
No expanded working has been attached for this question yet. The verified answer is Option D.
Source: Myschool Past Questions Archive (Record #23835)
Mathematics
WAEC / WASSCE 1996
Statistics and Probability
Solution
A bag contains 3 red, 4 black and 5 green identical balls. Two balls are picked at random, one after the other without replacement. Find the probability that one is red and the other is green
A
\(\frac{2}{3}\)
B
\(\frac{5}{11}\)
C
\(\frac{5}{22}\)
D
\(\frac{5}{24}\)
E
\(\frac{5}{48}\)
medium Difficulty
Verified Correct Answer: Option C
Step-by-Step Mathematical Solution
Total balls = 12
RG or GR
\(\frac{3}{12}\) x \(\frac{5}{11}\) + \(\frac{5}{12}\) x \(\frac{3}{11}\)
= \(\frac{5}{44}\) + \(\frac{5}{44}\)
=\(\frac{10}{44}\)
=\(\frac{5}{22}\)
Source: Myschool Past Questions Archive (Record #23838)
Mathematics
WAEC / WASSCE 1996
Statistics and Probability
Diagram
Solution
The table gives the distribution of outcomes obtained when a die was rolled 100 times.
What is the experimental probability that it shows at most 4 when rolled again?
Attached Figure / Diagram

A
8/25
B
12/25
C
13/25
D
2/3
E
17/25
medium Difficulty
Verified Correct Answer: Option E
Step-by-Step Mathematical Solution
18 + 14 + 20 + 16/100 = 17/25
Source: Myschool Past Questions Archive (Record #23839)
Mathematics
WAEC / WASSCE 1996
Statistics and Probability
Solution
The table below shows the marks obtained by forty pupils in a Mathematics test.
Marks
0 - 9
10 - 19
20 - 29
30 - 39
40 - 49
50 - 59
No of pupils
4
5
6
12
8
5
(a) Draw a histogram for the mark distribution ;
(b) Use your histogram to estimate the mode ;
(c) Calculate the median of the distribution.
medium Difficulty
Verified Correct Answer: Option
Step-by-Step Mathematical Solution
(a)
Marks
Class boundary
Freq
Cum freq
0 - 9
0 - 9.5
4
4
10 - 19
9.5 - 19.5
5
9
20 - 29
19.5 - 29.5
6
15
30 - 39
29.5 - 39.5
12
27
40 - 49
39.5 - 49.5
8
35
50 - 59
49.5 - 59.5
5
40
(b) Mode = 35.5
(c) Median = \(L_{1} + \frac{(\frac{N}{2} - \sum f_{p}) \times c}{f_{m}}\)
where \(L_{1}\) = lower class boundary of median class = 29.5
\(N = \sum f = 40\) ; \(\sum f_{p}\) = cumulative frequency before median class = 15.
\(f_{m}\) = frequency of median class = 12, c = class interval = 10.
Median = \(29.5 + \frac{(\frac{40}{2} - 15) \times 10}{12}\)
= \(29.5 + \frac{(20 - 15) \times 10}{12}\)
= \(29.5 + 4.17 = 33.67\)
Source: Myschool Past Questions Archive (Record #54502)
Mathematics
WAEC / WASSCE 1995
Statistics and Probability
Solution
What is the mode of the numbers 8, 10, 9, 9, 10, 8, 11, 8, 10, 9, 8 and 14?
A
8
B
9
C
10
D
11
E
14
medium Difficulty
Verified Correct Answer: Option A
Step-by-Step Mathematical Solution
The mode = 8 with the highest frequency of 4 times.
Source: Myschool Past Questions Archive (Record #23786)
Mathematics
WAEC / WASSCE 1995
Statistics and Probability
Solution
The mean of 20 observations in an experiment is 4, lf the observed largest value is 23, find the mean of the remaining observations.
A
4
B
3
C
2.85
D
2.60
E
2.56
medium Difficulty
Verified Correct Answer: Option B
Step-by-Step Mathematical Solution
Mean of 20 observations = 4
All the observations = 20 x 4 = 80
Largest observed value = 23
Remaining observation = 80 - 23 = 57
Mean of observation = 57/19 = 3
Source: Myschool Past Questions Archive (Record #23787)
Mathematics
WAEC / WASSCE 1995
Statistics and Probability
Solution
Find the median of the following numbers 2.64, 2.50, 2.72, 2.91 and 2.35.
A
2.91
B
2.72
C
2.64
D
2.50
E
2.35
medium Difficulty
Verified Correct Answer: Option C
Step-by-Step Mathematical Solution
Arranging the numbers in ascending order, we have
2.35, 2.50, 2.64, 2.72, 2.91.
The median = 2.64
Source: Myschool Past Questions Archive (Record #23788)