Question Library
Browse, filter, and study verified past examination questions with step-by-step mathematical reasoning.
Searching 18,000+ Questions...
Sifting topics, KaTeX formulas & verified solutions
Showing 23161–23175 of 29811 verified questions
Sort by:
Mathematics
UTME / JAMB 1993
Statistics (Data Representation, Central Tendency & Dispersion)
Solution
The mean of the ages of ten secondary school pupils is 16 but when the age of their teacher is added to it the men becomes 19. Find the age of the teacher
A
27
B
35
C
38
D
49
medium Difficulty
Verified Correct Answer: Option D
Step-by-Step Mathematical Solution
Average age of 110 students = 16
∴ Total age = 16 x 10 = 160 years
Age of teachers = x, total number of people now = 11
mean age = 19
Total age of new group = 19 x 11 = 209
Age of teachers = x = (209 - 160) = 49 yrs
Source: Myschool Past Questions Archive (Record #31274)
Mathematics
UTME / JAMB 1993
Statistics (Data Representation, Central Tendency & Dispersion)
Solution
\(\begin{array}{c|c} Class & Frequency\\ \hline 1 - 5 & 2\\6 - 10 & 4\\11 - 15 & 5\\16 - 20 & 2 \\ 21 - 25 & 3\\26 - 30 & 2\\31 - 35 & 1\\36 - 40 & 1 \end{array}\)
Find the median of the observation in the table given
A
11.5
B
12.5
C
14.0
D
14.5
medium Difficulty
Verified Correct Answer: Option D
Step-by-Step Mathematical Solution
Median = L1 + (\(\frac{Ef}{fm}\)) - fo
\(\frac{\sum f}{2}\)
= \(\frac{20}{2}\)
= 10, L1 = 10.5, fo = 6, fm = 5
Median = 10.5 + \(\frac{(10 - 6)}{5}\)5
= 10.5 + 4
= 14.5
Source: Myschool Past Questions Archive (Record #31280)
Mathematics
UTME / JAMB 1993
Permutations, Combinations & Probability
Solution
A number is selected at random between 20 and 30, both numbers inclusive. Find the probability that the number is a prime
A
\(\frac{2}{11}\)
B
\(\frac{5}{11}\)
C
\(\frac{6}{11}\)
D
\(\frac{8}{11}\)
medium Difficulty
Verified Correct Answer: Option A
Step-by-Step Mathematical Solution
Possible outcomes are 20, 21, 22, 23, 24, 25, 26, 27, 28, 29, 30. Prime numbers has only two factors
itself and 1
The prime numbers among the group are 23, 29. Probability of choosing a prime number
= \(\frac{\text{Number of prime}}{\text{No. of total Possible Outcomes}}\)
= \(\frac{2}{11}\)
Source: Myschool Past Questions Archive (Record #31285)
Mathematics
UTME / JAMB 1993
Statistics (Data Representation, Central Tendency & Dispersion)
Solution
Calculate the standard deviation of the following data: 7, 8, 9, 10, 11, 12, 13.
A
2
B
4
C
10
D
11
medium Difficulty
Verified Correct Answer: Option A
Step-by-Step Mathematical Solution
\(\begin{array}{c|c} x & x - x & (x - x)^2\\ \hline 7 & -3 & 9\\8 & -2 & 4 \\9 & -1 & 1\\10 & 0 & 1\\11 & 1 & 1\\ 12 & 2 & 4\\13 & 3 & 9\\ \hline & & 28\end{array}\)
S.D = \(\sqrt{\frac{\sum(x - x)^2}{N}}\)
= \(\sqrt{\frac{\sum d^2}{N}}\)
= \(\sqrt{\frac{28}{7}}\)
= \(\sqrt{4}\)
= 2
Source: Myschool Past Questions Archive (Record #31288)
Mathematics
UTME / JAMB 1993
Sets, Logic & Venn Diagrams
Solution
The chances of three independent events X, Y, Z occurring are \(\frac{1}{2}\), \(\frac{2}{3}\), \(\frac{1}{4}\) respectively. What are the chances of Y and Z only occurring?
A
\(\frac{1}{8}\)
B
\(\frac{1}{24}\)
C
\(\frac{1}{12}\)
D
\(\frac{1}{4}\)
medium Difficulty
Verified Correct Answer: Option C
Step-by-Step Mathematical Solution
Chance of x = \(\frac{1}{2}\)
Change of Y = \(\frac{2}{3}\)
Chance of Z = \(\frac{1}{4}\)
Chance of Y and Z only occurring
= Pr (Y ∩ Z ∩ Xc)
where Xc = 1 - Pr(X)
1 - \(\frac{1}{2}\) = \(\frac{1}{2}\)
= Pr(Y) x Pr(Z) x Pr(Xc)
= \(\frac{2}{3}\) x \(\frac{1}{4}\) x \(\frac{1}{2}\)
= \(\frac{1}{12}\)
Source: Myschool Past Questions Archive (Record #31290)
Mathematics
UTME / JAMB 1993
Coordinate Geometry
Diagram
Solution
The figure represents the graphs of y = x(2 - x) and y = (x - 1)(x - 3). What are the x-coordinates of P, Q and F respectively?
Attached Figure / Diagram
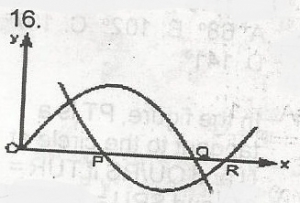
A
1, 3, 2
B
0, 0, 0
C
0, 2, 3
D
1, 2, 3
medium Difficulty
Verified Correct Answer: Option D
Step-by-Step Mathematical Solution
The two equations are y = x(2 - x) and y = (x - 1)(x - 3)
The root of these equations are points where the graph of the equations cuts the x axis; but at these points = 0
put y = 0; 0 = x(2 - x)
0 = (x - 1)(x - 3)
x = 0 or x = 2; x = 1 or x = 3
The values of x at P, Q, R are increasing towards the positive direction of x-axis
at P, x = 1 at Q, x = 2 at R, x = 3
P, Q, R are respectively (1, 2, 3)
Source: Myschool Past Questions Archive (Record #32992)
Mathematics
UTME / JAMB 1993
Plane Geometry, Polygons & Circle Theorems
Diagram
Solution
PQRST is a regular pentagon and PQVU is a rectangle with U and V lying on TS and SR respectively as shown in the diagram. Calculate TUP
Attached Figure / Diagram
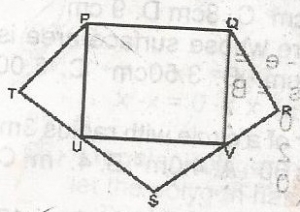
A
18o
B
54o
C
90o
D
108o
medium Difficulty
Verified Correct Answer: Option B
Step-by-Step Mathematical Solution
The total angle in a regular pentagon = \((2(5) - 4) \times 90\)
= \(6 \times 90 = 540^\circ\)
Each interior angle = \(\frac{540}{5} = 108^\circ\)
While the interior of a quadrilateral = \(\frac{360}{4} = 90^\circ\)
\(PTU + TPU + TUP = 180^\circ\)
\(108^\circ + (180^\circ - 90^\circ) + TUP = 180^\circ\)
\(TUP = 180^\circ - (108^\circ + 18^\circ) = 54^\circ\)
Source: Myschool Past Questions Archive (Record #32993)
Mathematics
UTME / JAMB 1993
Plane Geometry, Polygons & Circle Theorems
Diagram
Solution
In the diagram, PQRS is a circle with O as centre and PQ||RT. If RTS = 32^\circ. Find PSQ
Attached Figure / Diagram
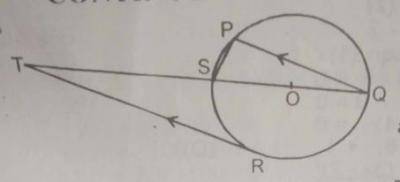
A
32o
B
45o
C
58o
D
90o
medium Difficulty
Verified Correct Answer: Option C
Step-by-Step Mathematical Solution
< PSO = \(\frac{1}{2}\) < SOQ = \(\frac{1}{2}\)(180) = 90^\circ
< RTS = < PQS = 32^\circ (Alternative angle)
< PSQ = 90 - < PSQ = 90^\circ - 32^\circ
= 58^\circ
Source: Myschool Past Questions Archive (Record #32994)
Mathematics
UTME / JAMB 1993
Plane Geometry, Polygons & Circle Theorems
Diagram
Solution
In the diagram, O is the centre of the circle and POQ a diameter. If POR = 96o, find the value of ORQ.
Attached Figure / Diagram
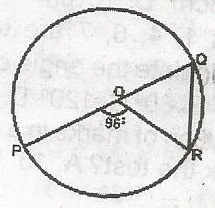
A
84o
B
48o
C
45o
D
42o
medium Difficulty
Verified Correct Answer: Option B
Step-by-Step Mathematical Solution
OQ = OR = radii
< ROQ = 180 - 96 = 84º
\(\bigtriangleup\)OQR = Isosceles
R = Q
R + Q + 84 = 180(angle in a \(\bigtriangleup\))
2R = 96 since R = Q
R = 48º
ORQ = 48º
Source: Myschool Past Questions Archive (Record #32995)
Mathematics
UTME / JAMB 1993
Plane Geometry, Polygons & Circle Theorems
Diagram
Solution
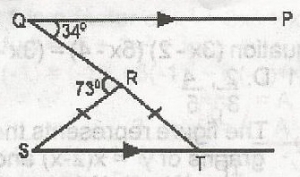
In the diagram, QP//ST:PQR = 34o qrs = 73o and Rs = RT. Find SRT
Attached Figure / Diagram
A
68o
B
102o
C
107o
D
141o
medium Difficulty
Verified Correct Answer: Option B
Step-by-Step Mathematical Solution
Construction joins R to P such that SRP = straight line
R = 180o - 107o
< p = 180o - (107o - 34o)
108 - 141o = 39o
Angle < S = 39o (corr. Ang.) But in \(\bigtriangleup\)SRT
< S = < T = 39o
SRT = 180 - (39o + 39o)
= 180o - 78o
= 102o
Source: Myschool Past Questions Archive (Record #32996)
Mathematics
UTME / JAMB 1993
Plane Geometry, Polygons & Circle Theorems
Diagram
Solution
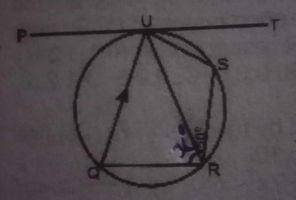
In the figure, PT is tangent to the circle at U and QU/RS if TUR = 35º and SRU = 50º find x
Attached Figure / Diagram
A
95o
B
85o
C
50o
D
35o
medium Difficulty
Verified Correct Answer: Option A
Step-by-Step Mathematical Solution
Since QRU= Xo
RSU = Xo, But RSU = 180o - (50o + 35o)
= 180o - 85o
= 95o
x = 95o
Source: Myschool Past Questions Archive (Record #32997)
Mathematics
UTME / JAMB 1993
Plane Geometry, Polygons & Circle Theorems
Diagram
Solution
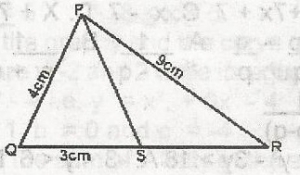
In the diagram, QPS = SPR, PR = 9cm. PQ = 4cm and QS = 3cm, find SR.
Attached Figure / Diagram
A
6\(\frac{3}{4}\)cm
B
3\(\frac{3}{8}\)cm
C
4\(\frac{3}{8}\)cm
D
2\(\frac{3}{8}\)cm
medium Difficulty
Verified Correct Answer: Option A
Step-by-Step Mathematical Solution
Using angle bisector theorem: line PS bisects angle QPR
QS/QP = SR/PR
3/4 = SR/9
4SR = 27
SR = \(\frac{27}{4}\)
= 6\(\frac{3}{4}\)cm
Source: Myschool Past Questions Archive (Record #33005)
Mathematics
UTME / JAMB 1993
Indices, Logarithms & Surds
Diagram
Solution
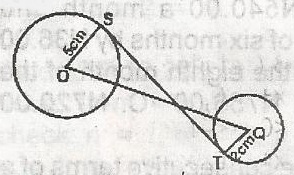
In the figure, the line segment ST is tangent to two circles at S and T. O and Q are the centres of the circles wih OS = 5cm. QT = 2cm and OR = 14cm. Find ST
Attached Figure / Diagram
A
7 \(\sqrt{3}\)cm
B
12.9cm
C
\(\sqrt{87}\)cm
D
7cm
medium Difficulty
Verified Correct Answer: Option B
Step-by-Step Mathematical Solution
SQ2 + OS2 = OQ2 + 52 = 142
SQ2 = 142 - 52
196 - 25 = 171
ST2 + TQ2 = SQ2
ST2 + 22 = 171
ST2 = 171 - 4
= 167
ST = \(\sqrt{167}\)
= 12.92 = 12.9cm
Source: Myschool Past Questions Archive (Record #33007)
Mathematics
UTME / JAMB 1993
Fractions, Decimals, Percentages & Approximations
Diagram
Solution
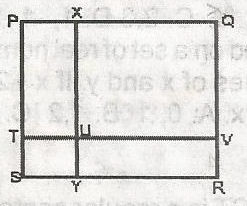
In the figure, the area of the square of the square PQRS is 100cm2. If the ratio of the area of the square TUYS to the area of the area of the square XQVU is 1 : 16, Find YR
Attached Figure / Diagram
A
6cm
B
7cm
C
8cm
D
9cm
medium Difficulty
Verified Correct Answer: Option C
Step-by-Step Mathematical Solution
Since area of square PQRS = 100cm2
each lenght = 10cm
Also TUYS : XQVU = 1 : 16
lengths are in ratio 1 : 4, hence TU : UV = 1: 4
Let TU = x
UV = 1: 4
hence TV = x + 4x = 5x = 10cm
x = 2cm
TU = 2cm
UV = 8cm
But TU = SY and UV = YR
YR = 8cm
Source: Myschool Past Questions Archive (Record #33014)
Mathematics
UTME / JAMB 1993
Statistics (Data Representation, Central Tendency & Dispersion)
Diagram
Solution
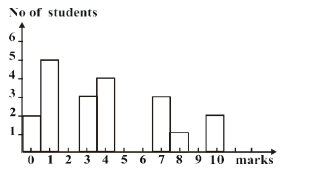
The bar chart shows the distribution of marks in a class test. How many students took the test?
Attached Figure / Diagram
A
15
B
20
C
25
D
30
medium Difficulty
Verified Correct Answer: Option B
Step-by-Step Mathematical Solution
Number f students that took the test = \(\sum f\). Where f is the frequencies
= 2 + 5 + 0 + 3 + 4 + 0 + 0 + 2 + 3 + 1 + 2 = 20
Source: Myschool Past Questions Archive (Record #33021)