Question Library
Browse, filter, and study verified past examination questions with step-by-step mathematical reasoning.
Searching 18,000+ Questions...
Sifting topics, KaTeX formulas & verified solutions
Showing 166–180 of 345 verified questions
Sort by:
Mathematics
WAEC / WASSCE 2004
Statistics and Probability
Diagram
Solution
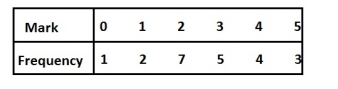
The table above gives the marks scored by a group of students in a test. Use the table to answer the Question below
What is the median mark?
Attached Figure / Diagram
A
1
B
2
C
3
D
4
medium Difficulty
Verified Correct Answer: Option C
Step-by-Step Mathematical Solution
Median = 0, 1, 1, 2, 2, 2, 2, 2, 2, 2, 3, 3, 3, 3, 3, 4, 4, 4, 4, 5, 5, 5
Median mark = \(\frac{3+3}{2} = \frac{6}{2} = 3\)
Source: Myschool Past Questions Archive (Record #26653)
Mathematics
WAEC / WASSCE 2004
Statistics and Probability
Diagram
Solution
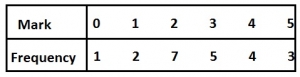
The table above gives the marks scored by a group of students in a test Use the table to answer the Question below
What is the probability of selecting a student from the group that scored 2 or 3?
Attached Figure / Diagram
A
\(\frac{1}{11}\)
B
\(\frac{5}{22}\)
C
\(\frac{7}{22}\)
D
\(\frac{6}{11}\)
medium Difficulty
Verified Correct Answer: Option D
Step-by-Step Mathematical Solution
Prob (2 or 3) = prob(2) + prob(3)
Prob (mark 2) \(=\frac{7}{22}\) + Prob(mark 3) = \(\frac{5}{22}\)
Prob(2 or 3) \(=\frac{7}{22}+\frac{5}{22}=\frac{12}{22}=\frac{6}{11}\)
Source: Myschool Past Questions Archive (Record #26654)
Mathematics
WAEC / WASSCE 2004
Statistics and Probability
Solution
A bag contains 3 red and 2 white identical balls. lf 2 balls are picked at random from the bag, one after the other and with replacement, find the probability that they are of different colours
A
\(\frac{36}{625}\)
B
\(\frac{16}{625}\)
C
\(\frac{12}{25}\)
D
\(\frac{13}{25}\)
medium Difficulty
Verified Correct Answer: Option C
Step-by-Step Mathematical Solution
Prob(RW or WR) = Prob(RW) + Prob(WR)
\(Prob(R) = \frac{3}{5}:Prob(W) = \frac{2}{5}\\
Prob(RW\hspace{1mm}or\hspace{1mm}WR)=\frac{3}{5}\times\frac{2}{5}+\frac{2}{5}\times \frac{3}{5}\\
\frac{6}{25}+\frac{6}{25}=\frac{12}{25}\)
Source: Myschool Past Questions Archive (Record #26668)
Mathematics
NECO SSCE 2004
Statistics and Probability
Solution
If the first term of an AP is 1.2 and the common difference is also 2, what is the mean of the first five terms?
A
2
B
4
C
5
D
8
E
10
medium Difficulty
Verified Correct Answer: Option C
Step-by-Step Mathematical Solution
Given the first term \( a = 1.2 \) and common difference \( d = 2 \), the first five terms of the AP are:
\(a_1 = 1.2\)
\(a_2 = 1.2 + 2 = 3.2\)
\(a_3 = 1.2 + 4 = 5.2 \)
\(a_4 = 1.2 + 6 = 7.2 \)
\(a_5 = 1.2 + 8 = 9.2\)
The sum of the first five terms is:
\(\text{Sum} = 1.2 + 3.2 + 5.2 + 7.2 + 9.2 = 26\)
The mean is calculated as:
\(\text{Mean} = \frac{26}{5} = 5.2\)
Thus, the mean of the first five terms is \(5.2\).
Source: Myschool Past Questions Archive (Record #42289)
Mathematics
NECO SSCE 2004
Statistics and Probability
Solution
If the mean of the following set of data, 2, 3,3,3, 2,4, 4, and 3 is divided by its mode, the result is:
A
1
B
2
C
3
D
5
E
8
medium Difficulty
Verified Correct Answer: Option A
Step-by-Step Mathematical Solution
The mean of 2, 3, 3, 3, 4,4, and 3 = \(\frac{ 2 + 3 + 3 + 3 + 2+ 4 + 4 +3}{ 8} = \frac{24}{8}\) = 3
The mode of 2, 3, 3, 3, 4, 4, and 3 = 3
Hence, the mean of 2,3,3,3,4,4, and 3 divided by its mode = \(\frac{3}{3}\) = 1
Source: Myschool Past Questions Archive (Record #42329)
Mathematics
NECO SSCE 2004
Statistics and Probability
A bag Contains 2 red, 3 blue and 4 green identical balls. If two balls are picked at random one after the other without replacement, what is the probability that both are green?
A
\(\frac{1}{6}\)
B
\(\frac{1}{3}\)
C
\(\frac{16}{18}\)
D
\(\frac{3}{8}\)
E
\(\frac{4}{9}\)
medium Difficulty
Verified Correct Answer: Option A
Step-by-Step Mathematical Solution
No expanded working has been attached for this question yet. The verified answer is Option A.
Source: Myschool Past Questions Archive (Record #42331)
Mathematics
UTME / JAMB 2003
Statistics and Probability
Solution
By how much is the mean of 30, 56, 31, 55, 43 and 44 less than the median?
A
0.75
B
0.50
C
0.33
D
0.17
medium Difficulty
Verified Correct Answer: Option C
Step-by-Step Mathematical Solution
\(Mean = \frac{30+56+31+55+43+44}{6}\)
= \(\frac{259}{6}\) = 43.167
Median = 30,31,43,44,55,56 = \(\frac{43+44}{2}\)
=\( \frac{87}{2}\) = 43.5
Median-mean = 43.5 - 43.17 = 0.33
Source: Myschool Past Questions Archive (Record #7840)
Mathematics
UTME / JAMB 2003
Statistics and Probability
Solution
Find the mean of the distribution above
value
0
1
2
3
4
Frequency
1
2
2
1
9
A
1
B
2
C
3
D
4
medium Difficulty
Verified Correct Answer: Option C
Step-by-Step Mathematical Solution
Mean = \(\frac{(0 \times 1) + (1 \times 2) + (2 \times 2) + (3 \times 1) + (4 \times 9)}{1 + 2 + 2 + 1 + 9}\)
= \(\frac{(0 + 2 + 4 + 3 + 36)}{15}\)
= \(\frac{45}{15}\) =3
Source: Myschool Past Questions Archive (Record #7842)
Mathematics
UTME / JAMB 2003
Statistics and Probability
Solution
A bag contains 5 blacks balls and 3 red balls. Two balls are picked at random without replacement. What is the probability that a black and red balls are picked?
A
\(\frac{15}{28}\)
B
\(\frac{13}{28}\)
C
\(\frac{5}{14}\)
D
\(\frac{3}{14}\)
medium Difficulty
Verified Correct Answer: Option A
Step-by-Step Mathematical Solution
Black balls = 5
Red balls = 3
P(B) = \(\frac{5}{8}\), P(R) = \(\frac{3}{8}\)
P( a Black and a Red) = black ball and red ball or red ball and black ball i.e BR + RB
= (\(\frac{5}{8}\)) * (\(\frac{3}{7}\)) + (\(\frac{3}{8}\)) * (\(\frac{5}{7}\))
= (\(\frac{15}{56}\)) + (\(\frac{15}{56}\))
= \(\frac{30}{56}\)
= \(\frac{15}{28}\)
Source: Myschool Past Questions Archive (Record #7846)
Mathematics
WAEC / WASSCE 2003
Statistics and Probability
Diagram
Solution
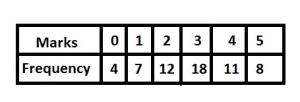
The table below gives the distribution of marks obtained by a number of pupils in a class test.
The mode of the distribution is
Attached Figure / Diagram
A
3
B
5
C
8
D
18
medium Difficulty
Verified Correct Answer: Option A
Step-by-Step Mathematical Solution
From the given table, the most common mark is 3 with a frequency of 18
Source: WAEC / JAMB / NECO Classroom Archive (Record #26571)
Mathematics
WAEC / WASSCE 2003
Statistics and Probability
Diagram
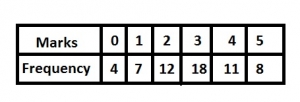
The table below gives the distribution of marks obtained by a number of pupils in a class test.
Find the median of the distribution
Attached Figure / Diagram
A
1
B
2
C
3
D
4
medium Difficulty
Verified Correct Answer: Option C
Step-by-Step Mathematical Solution
No expanded working has been attached for this question yet. The verified answer is Option C.
Source: Myschool Past Questions Archive (Record #26572)
Mathematics
WAEC / WASSCE 2003
Statistics and Probability
Solution
Out of 60 members of an Association, 15 are Doctors and 9 are Lawyers. If a member is selected at random from the Association, what is the probability that the member is neither a Doctor Nor a Lawyer
A
\(\frac{3}{5}\)
B
\(\frac{9}{10}\)
C
\(\frac{3}{20}\)
D
\(\frac{1}{4}\)
medium Difficulty
Verified Correct Answer: Option A
Step-by-Step Mathematical Solution
Member that are neither doctors nor lawyers = 60-(15+9)=36
Probability (Not doctors ad not lawyers) \(=\frac{36}{60}\\
=\frac{6}{10}=\frac{3}{5}\)
Source: Myschool Past Questions Archive (Record #26593)
Mathematics
UTME / JAMB 2003
Statistics and Probability
Solution
Two dice are thrown. What is the probability that the sum of the numbers is divisible by 3?
A
\(\frac{1}{4}\)
B
\(\frac{2}{3}\)
C
\(\frac{1}{2}\)
D
\(\frac{1}{3}\)
medium Difficulty
Verified Correct Answer: Option D
Step-by-Step Mathematical Solution
The two dice produce 36 equally likely outcomes in total.
The sums divisible by 3 are exactly 3, 6, 9, and 12. The complete list of favorable pairs \((d_1, d_2)\) is:
Sum = 3 (2 ways):
(1,2), (2,1)
Sum = 6 (5 ways):
(1,5), (2,4), (3,3), (4,2), (5,1)
Sum = 9 (4 ways):
(3,6), (4,5), (5,4), (6,3)
Sum = 12 (1 way):
(6,6)
Total favourable outcomes: 2 + 5 + 4 + 1 = 12.
Therefore, the probability is
\(\frac{12}{36} = \frac{1}{3}.\)
Source: Myschool Past Questions Archive (Record #33110)
Mathematics
UTME / JAMB 2003
Statistics and Probability
Diagram
Solution
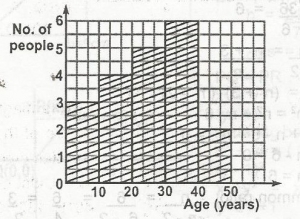
The histogram above shows the ages of victims of a pollution. How many people were involved in the pollution?
Attached Figure / Diagram
A
20
B
21
C
15
D
18
medium Difficulty
Verified Correct Answer: Option A
Step-by-Step Mathematical Solution
\(\begin{array}{c|c} \text{Age in years} & 10 & 20 & 30 & 40 & 50 \\\hline \text{frequency} & 3 & 4 & 5 & 6 & 2\end{array}\)
\(\sum f \) = number of people involved in the pollution
\(\sum f\) = 3 + 4 + 5 + 6 + 2 = 20
Source: Myschool Past Questions Archive (Record #33111)
Mathematics
WAEC / WASSCE 2003
Statistics and Probability
Solution
The table shows the number of suitcases possessed by a group of travellers.
No. of suitcases
0
1
2
3
4
5
Travellers
2
7
7
2
3
9
(a) Calculate the (i) median (ii) mean, correct to the nearest whole number.
(b) Draw a bar chart to represent the information.
medium Difficulty
Verified Correct Answer: Option
Step-by-Step Mathematical Solution
x
0
1
2
3
4
5
7
2
7
7
2
3
9
fx
0
7
14
6
12
45
(a)(i) Median = \(\frac{1}{2} (N + 1)\)
= \(\frac{1}{2}(30 + 1) = 15.5\)
= 15th and 16th position
= \(\frac{2 + 2}{2} = 2\)
(ii) Mean = \(\frac{\sum fx}{\sum f}\)
= \(\frac{84}{30}\)
= \(2.8 \approxeq 3\) (nearest whole no).
(b)
Source: Myschool Past Questions Archive (Record #53270)