Question Library
Browse, filter, and study verified past examination questions with step-by-step mathematical reasoning.
Searching 18,000+ Questions...
Sifting topics, KaTeX formulas & verified solutions
Showing 136–150 of 345 verified questions
Sort by:
Mathematics
WAEC / WASSCE 2007
Statistics and Probability
Solution
The table shows the ages(in years) of twenty children chosen at random from a community. What is the mean age? \(\begin{array}{c|c} Age(years) & 1 & 2 & 3 & 4 & 5 \\ \hline {\text {Number of children}} & 2 & 3 & 5 & 6 & 4 \end{array}\)
A
4.46 years
B
3.35 years
C
3.30years
D
3.00 years
medium Difficulty
Verified Correct Answer: Option B
Step-by-Step Mathematical Solution
Mean(age) = \(\frac{(1 \times 2) + (2 \times 3) + (3 \times 5) + (4 \times 6) + (5 \times 4)}{2 + 3 + 5 + 6 + 4}\)
= \(\frac{2 + 6 + 15 + 24 + 20}{20}\)
= \(\frac{67}{20}\)
= 3.35yrs
Source: Myschool Past Questions Archive (Record #36276)
Mathematics
WAEC / WASSCE 2007
Statistics and Probability
Solution
The table shows the ages(in years) of twenty children chosen at random from a community. What is the median of the distribution? \(\begin{array}{c|c} Age(years) & 1 & 2 & 3 & 4 & 5 \\ \hline {\text {Number of children}} & 2 & 3 & 5 & 6 & 4 \end{array}\)
A
3.5 years
B
3.0 years
C
2.5 years
D
2.0 years
medium Difficulty
Verified Correct Answer: Option A
Step-by-Step Mathematical Solution
Median = (\(\frac{n + 1}{2})^{th}\)
= \(\frac{20 + 1}{2} = \frac{21}{2}\)
= 10.5
= \(\frac{{\text{10th term and 11th term}}}{2}\)
= \(\frac{3 + 4}{2} = \frac{7}{2}\)
= 3.5yrs
Source: Myschool Past Questions Archive (Record #36277)
Mathematics
WAEC / WASSCE 2007
Statistics and Probability
Solution
Divide the sum of 8, 6, 7, 2, 0, 4, 7, 2, 3, by their mean
A
9
B
8
C
7
D
6
medium Difficulty
Verified Correct Answer: Option A
Step-by-Step Mathematical Solution
Sum = 8 + 6 + 7 + 2 + 0 + 4 + 7 + 2 + 3 = 39
mean = \(\frac{39}{9}\) = 4.33
then \(\frac{sum}{mean}\) = \(\frac{39}{4.33}\)
= 9
Source: Myschool Past Questions Archive (Record #36279)
Mathematics
WAEC / WASSCE 2007
Statistics and Probability
Solution
Out of the 24 apples in a box, 6 are bad. If three apples are taken from the box at random, with replacement, find the probability that :
(a) the first two are good and the third is bad ;
(b) all three are bad ;
(c) all the three are good.
medium Difficulty
Verified Correct Answer: Option
Step-by-Step Mathematical Solution
(a) \(P(Good) = \frac{18}{24} = \frac{3}{4}\)
\(P(Bad) = \frac{6}{24} = \frac{1}{4}\)
P(2 are good and 1 bad) = \(\frac{3}{4} \times \frac{3}{4} \times \frac{1}{4}\)
= \(\frac{9}{64}\)
(b) P(the 3 are bad) = \(\frac{1}{4} \times \frac{1}{4} \times \frac{1}{4}\)
= \(\frac{1}{64}\)
(c) P(the 3 are good) = \(\frac{3}{4} \times \frac{3}{4} \times \frac{3}{4}\)
= \(\frac{27}{64}\)
Source: Myschool Past Questions Archive (Record #52972)
Mathematics
UTME / JAMB 2007
Statistics and Probability
Diagram
Solution
The cumulative frequency for 5\(\leq\) x \(\leq\) 12 from the distribution above is
Attached Figure / Diagram

A
22
B
40
C
46
D
72
medium Difficulty
Verified Correct Answer: Option D
Step-by-Step Mathematical Solution
The cumulative frequency 5\(\leq\) x \(\leq\) 12 = 10 + 12 + 10 + 8 + 6 + 8 + 10 + 8 = 72
Source: Myschool Past Questions Archive (Record #72042)
Mathematics
UTME / JAMB 2006
Statistics and Probability
Diagram
Solution
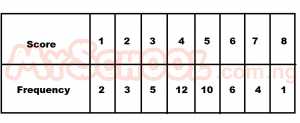
The table above shows the scores of a group of students in a physics test. If the mode is m and the number of students who scored 4 or more is n, what is (n, m)?
Attached Figure / Diagram
A
(33, 4)
B
(22, 4)
C
(33, 12)
D
(12, 4)
medium Difficulty
Verified Correct Answer: Option A
Step-by-Step Mathematical Solution
The mode (m) = 4.
No of students who scored 4 and above = 12 + 10 + 6 + 4 + 1 = 33.
\(\therefore\) (n, m) = (33, 4)
Source: Myschool Past Questions Archive (Record #8622)
Mathematics
UTME / JAMB 2006
Statistics and Probability
Solution
If the mean of five consecutive integers is 30, find the largest of the numbers
A
28
B
30
C
32
D
34
medium Difficulty
Verified Correct Answer: Option C
Step-by-Step Mathematical Solution
Let the consecutive numbers be a, a+1, a+2, a+3, a+4
Mean = \(\frac{(a+a+1+a+2+a+3+a+4)}{5}\)
30 = \(\frac{5a+10}{5}\)
30\( \times 5 = 5a + 10\)
5a = 150 - 10
5a = 140
a = 28
∴ a + 4 = 28 + 4
= 32
Source: Myschool Past Questions Archive (Record #8639)
Mathematics
UTME / JAMB 2006
Statistics and Probability
Solution
A bag contains 5 black, 4 white and x red marbles. If the probability of picking a red marble is 2/5, find the value of x
A
8
B
10
C
4
D
6
medium Difficulty
Verified Correct Answer: Option D
Step-by-Step Mathematical Solution
Black = 5
White = 4
Red = x
Total = 9+x
P(red) = 2/5
x / (9+x) = 2/5
5x = 2(9+x)
5x = 18+2x
5x-2 = 18
3x = 18
x = 6
Source: Myschool Past Questions Archive (Record #8656)
Mathematics
UTME / JAMB 2006
Statistics and Probability
Solution
Find the variance of 2x, 2x-1 and 2x+1
A
2/3
B
2
C
√(2/3)
D
1
medium Difficulty
Verified Correct Answer: Option A
Step-by-Step Mathematical Solution
\(\sum x = 6x\)
\(\sum(x-\bar{x})^2\) = 2
\(\bar{x} = \frac{\sum x}{n}\)
= \(\frac{6x}{3}\)
= 2x
Variance = \(\frac{\sum(x-\bar{x})^2}{n}\)
= \(\frac{2}{3}\)
Source: Myschool Past Questions Archive (Record #8663)
Mathematics
UTME / JAMB 2006
Statistics and Probability
Diagram
Solution
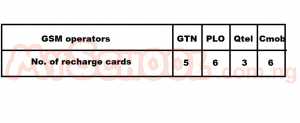
The table above shows the distribution of recharge cards of four major GSM operators. What is the probability that a recharge card selected at random will be GTN or Qtel?
Attached Figure / Diagram
A
3/20
B
1/4
C
2/5
D
3/4
medium Difficulty
Verified Correct Answer: Option C
Step-by-Step Mathematical Solution
P(GTN) = 5/20
P(Qtel) = 3/20
∴P(GTN or Qtel) = (5/20) + (3/20)
= 8/20
= 2/5
Source: Myschool Past Questions Archive (Record #8671)
Mathematics
WAEC / WASSCE 2006
Statistics and Probability
Solution
A fair coin is tossed three times. Find the probability of getting two heads and one tail.
A
\(\frac{1}{2}\)
B
\(\frac{3}{8}\)
C
\(\frac{1}{4}\)
D
\(\frac{1}{8}\)
medium Difficulty
Verified Correct Answer: Option B
Step-by-Step Mathematical Solution
Pr(head) = \(\frac{1}{2}\), Pr(tail) = \(\frac{1}{2}\):Pr(2 heads)
= \(\frac{1}{2}\) x \(\frac{1}{2}\) = \(\frac{1}{4}\)
Pr(2 heads and tail) 3 times
= (\(\frac{1}{4}\) x \(\frac{1}{2}\)) x 3
= \(\frac{3}{8}\)
Source: Myschool Past Questions Archive (Record #36162)
Mathematics
WAEC / WASSCE 2006
Statistics and Probability
Solution
Two fair dice are tossed together once.
(a) Draw a sample space for the possible outcomes ;
(b) Find the probability of getting a total : (i) of 7 or 8 ; (ii) less than 4.
medium Difficulty
Verified Correct Answer: Option
Step-by-Step Mathematical Solution
(a)
1
2
3
4
5
6
1
1, 1
1, 2
1, 3
1, 4
1, 5
1, 6
2
2, 1
2, 2
2, 3
2, 4
2, 5
2, 6
3
3, 1
3, 2
3, 3
3, 4
3, 5
3, 6
4
4,1
4, 2
4, 3
4, 4
4, 5
4, 6
5
5, 1
5, 2
5, 3
5, 4
5, 5
5, 6
6
6, 1
6, 2
6, 3
6, 4
6, 5
6, 6
(b) (i) P(getting a total of 7) = \(\frac{6}{36}\)
P(getting a total of 8) = \(\frac{5}{36}\)
P(getting a total of 7 or 8) = \(\frac{6}{36} + \frac{5}{36}\)
= \(\frac{11}{36}\)
(ii) P(getting a total less than 4) = \(\frac{3}{36}\)
= \(\frac{1}{12}\)
Source: Myschool Past Questions Archive (Record #53018)
Mathematics
WAEC / WASSCE 2006
Statistics and Probability
Solution
The following table shows the distribution of test scores in a class.
Scores
1
2
3
4
5
7
8
9
10
No of pupils
1
1
5
3
\(k^{2}+ 1\)
6
2
3
4
(a) If the mean score of the class is 6, find the : (i) value of k (ii) median score.
(b) Draw a bar chart for the distribution.
(c) If a pupil is picked at random, what is the probability that he/ she will score less than 6?
medium Difficulty
Verified Correct Answer: Option
Step-by-Step Mathematical Solution
(a)
Scores (x)
1
2
3
4
5
7
8
9
10
Total
No of pupils (f)
1
1
5
3
\(k^{2} + 1\)
6
2
3
4
\(k^{2} + 26\)
fx
1
2
15
12
\(5k^{2} + 5\)
42
16
27
40
\(5k^{2} + 160\)
\(\bar{x} = \frac{\sum fx}{\sum f}\)
\(6 = \frac{5k^{2} + 160}{k^{2} + 26}\)
\(6(k^{2} + 26) = 5k^{2} + 160\)
\(6k^{2} + 156 = 5k^{2} + 160\)
\(6k^{2} - 5k^{2} = 160 - 156\)
\(k^{2} = 4\)
\( k = \sqrt{4} = 2\)
\(\therefore k = 2\)
(ii) \(Median = \frac{5 + 7}{2}\)
= \(\frac{12}{2} = 6\)
(b)
(c) Probability of scoring less than 6 = \(\frac{15}{30} \)
= \(\frac{1}{2}\)
Source: Myschool Past Questions Archive (Record #53050)
Mathematics
UTME / JAMB 2005
Statistics and Probability
Diagram
Solution
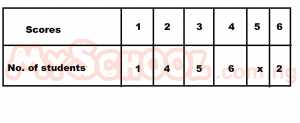
The table above shows that the scores of a group of students in a test. If the average score is 3.5, find the value of x
Attached Figure / Diagram
A
1
B
2
C
3
D
4
medium Difficulty
Verified Correct Answer: Option B
Step-by-Step Mathematical Solution
\(mean=\frac{60+5x}{18+x}\\3.5=\frac{60+5x}{18+x}\\\frac{7}{2}=\frac{60+5x}{18+x}\)
7(18+x) = 2(60+5x)
126 + 7x = 120 + 10x
10x - 7x = 126 - 120
3x = 6
x = 2
Source: Myschool Past Questions Archive (Record #8609)
Mathematics
UTME / JAMB 2005
Statistics and Probability
Solution
A box contains 5 blue balls, 3 red balls and 2 white balls. Two balls are selected from the box with replacement. Find the probability of obtaining two blue or two red balls
A
\(\frac{17}{50}\)
B
\(\frac{3}{25}\)
C
\(\frac{1}{50}\)
D
\(\frac{3}{250}\)
medium Difficulty
Verified Correct Answer: Option A
Step-by-Step Mathematical Solution
Blue balls = 5
Red balls = 3
White balls = 2
Total = 10
P(Two blue) = 5/10 * 5/10 = 25/100
P(Two Red) = 3/10 * 3/10 = 9/100
∴P(Two blue or two red balls)
= 25/100 + 9/100
= 34/100
= 17/50
Source: Myschool Past Questions Archive (Record #8614)