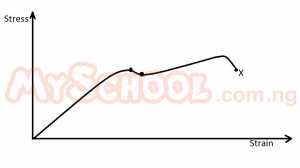
The diagram above represents the stress-strain graph for a typical metal rod. What does the X represent?
Attached Figure / Diagram
A
Breaking point
B
Yield point
C
Elastic limit
D
Proportional limit
Verified Correct Answer: A.
Physical Principles & Numerical Solution
In the stress - strain graph shown above, X represents the breaking point of the wire
Source: Myschool Past Questions Archive (Record #14282)