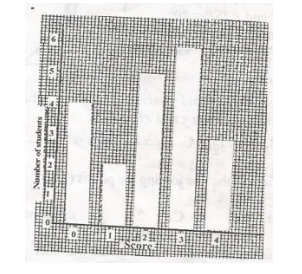
The bar chart shows the scores of some students in a test. If one students is selected at random, find the probability that he/she scored at most 2 marks
Attached Figure / Diagram
A
\(\frac{11}{18}\)
B
\(\frac{11}{20}\)
C
\(\frac{7}{22}\)
D
\(\frac{5}{19}\)
Verified Correct Answer: B.
Step-by-Step Mathematical Solution
at most 2 marks = 5 + 2 + 4 students = 11 students
probability(at most 2 marks) = \(\frac{11}{20}\)
Source: Myschool Past Questions Archive (Record #37000)