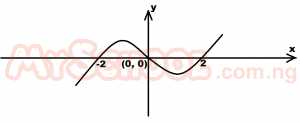
The diagram above is the graph of the function f(x). Determine the range of values of x for which f(x) \(\leq\) 0
Attached Figure / Diagram
A
x \(\leq\) 2
B
0 \(\leq\) x \(\leq\) 2
C
-2 \(\leq\) x \(\leq\) 0, x \(\geq\) 2
D
x \(\leq\) -2, 0 \(\leq\) x \(\leq\) 2
Verified Correct Answer: D.
Step-by-Step Mathematical Solution
The graph of the function f(x) is a curve that starts at (-2,0) and ends at (2,0) with a peak at (0,1). The range of values of x for which f(x) \le 0 is the interval where the function's graph is above or touches the x-axis. From the given graph, we can see that this interval is [-2, 2]. Therefore, the correct answer is x \(\leq\) - 2, 0 \(\leq\) x \(\leq\) 2
Source: Myschool Past Questions Archive (Record #8301)