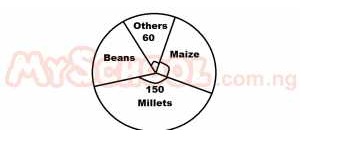
The pie chart above shows the distribution of the crops harvested from a farmland in a year. If 3000 tonnes of millet is harvested, what amount of beans is harvested
Attached Figure / Diagram
A
6000 tonnes
B
1500 tonnes
C
1200 tonnes
D
9000 tonnes
Verified Correct Answer: C.
Step-by-Step Mathematical Solution
Sectorial angle of beans = 360 - (150 + 90 + 60)
= 360 - 300
= 60º
If 150º represents 3000 tonnes
1º = \(\frac{3000}{150}\)
60º will represents (\(\frac{3000}{150}\)) x (\(\frac{60}{1}\))
= 1200 tonnes
Source: Myschool Past Questions Archive (Record #8192)