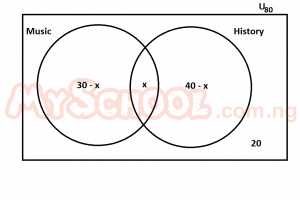
The venn diagram above shows the numbers of students offering music and history in a class of 80 students. If a student is picked at random from the class, what is the probability that he offers Music only?
Attached Figure / Diagram
A
0.38
B
0.13
C
0.50
D
0.25
Verified Correct Answer: D.
Step-by-Step Mathematical Solution
30 - x + x + 40 - x = 80 - 20
70 - x = 60
- x = 60 - 70
- x = - 10
∴ x = 10
Music only = 30 - x
= 30 - 10
20
P(music only) = 20/80
= 1/4
= 0.25
Source: Myschool Past Questions Archive (Record #7734)