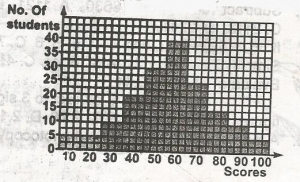
The histogram above represents the number of candidates that sat for Mathematics examination in a school. How many candidate scored more than 50 marks?
Attached Figure / Diagram
A
80
B
95
C
100
D
115
Verified Correct Answer: B.
Step-by-Step Mathematical Solution
\(\begin{array}{c|c} Mark & No. of Candidate\\\hline 60 & 40\\ 70 & 25\\ 80 & 15\\ 90 & 10 \\100 & 5 \\\hline & 95 \end{array}\)
Source: WAEC / JAMB / NECO Classroom Archive (Record #33142)