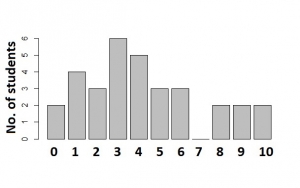
The bar chart shows the distribution of marks scored by a group of students in a test. Use the chart to answer the question below
How many students took the test?
Attached Figure / Diagram
A
38
B
32
C
15
D
11
Verified Correct Answer: B.
Step-by-Step Mathematical Solution
2 + 3 + 4 + 5 + 6 + 3 +3 + 0 + 2 + 2 + 2 = 32
Source: WAEC / JAMB / NECO Classroom Archive (Record #26442)